 |
 |
|
Synoptic Weather Charts and Computer Model Forecasts |
|||||||||||||
|
Met
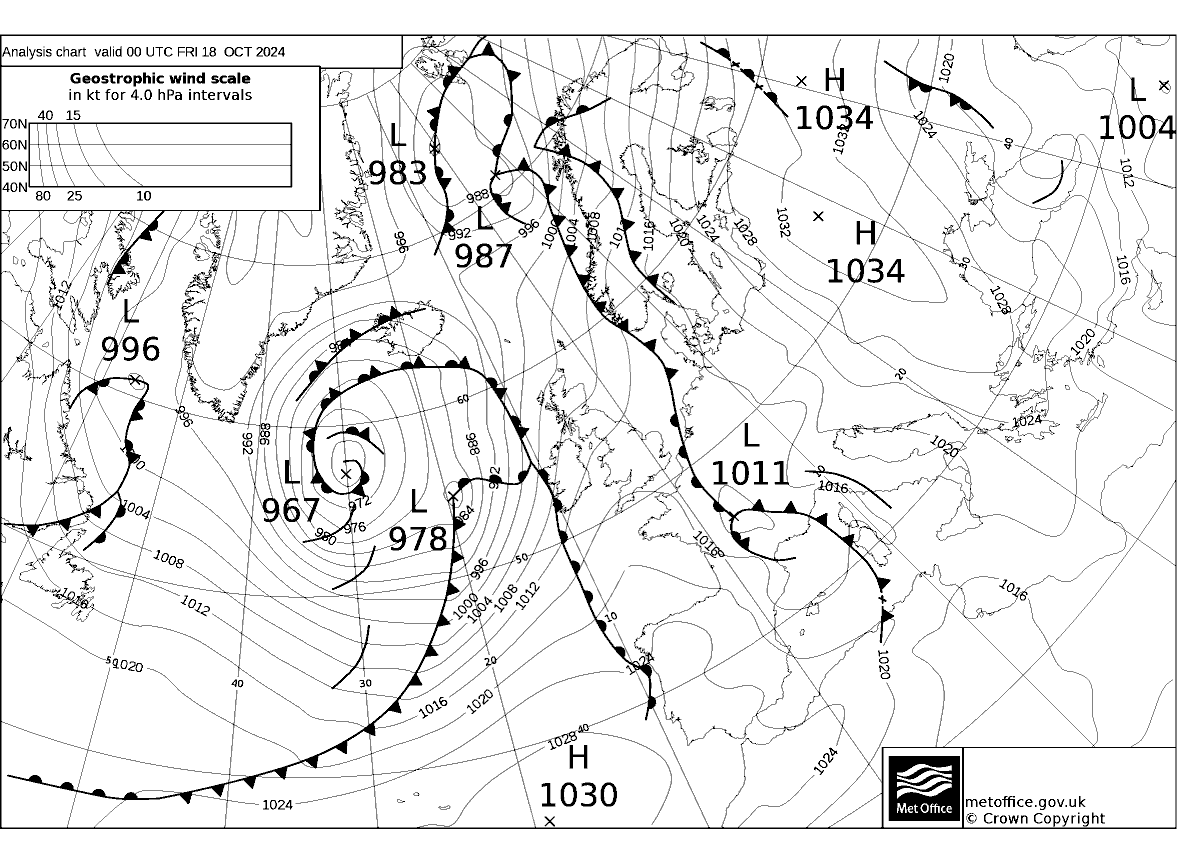
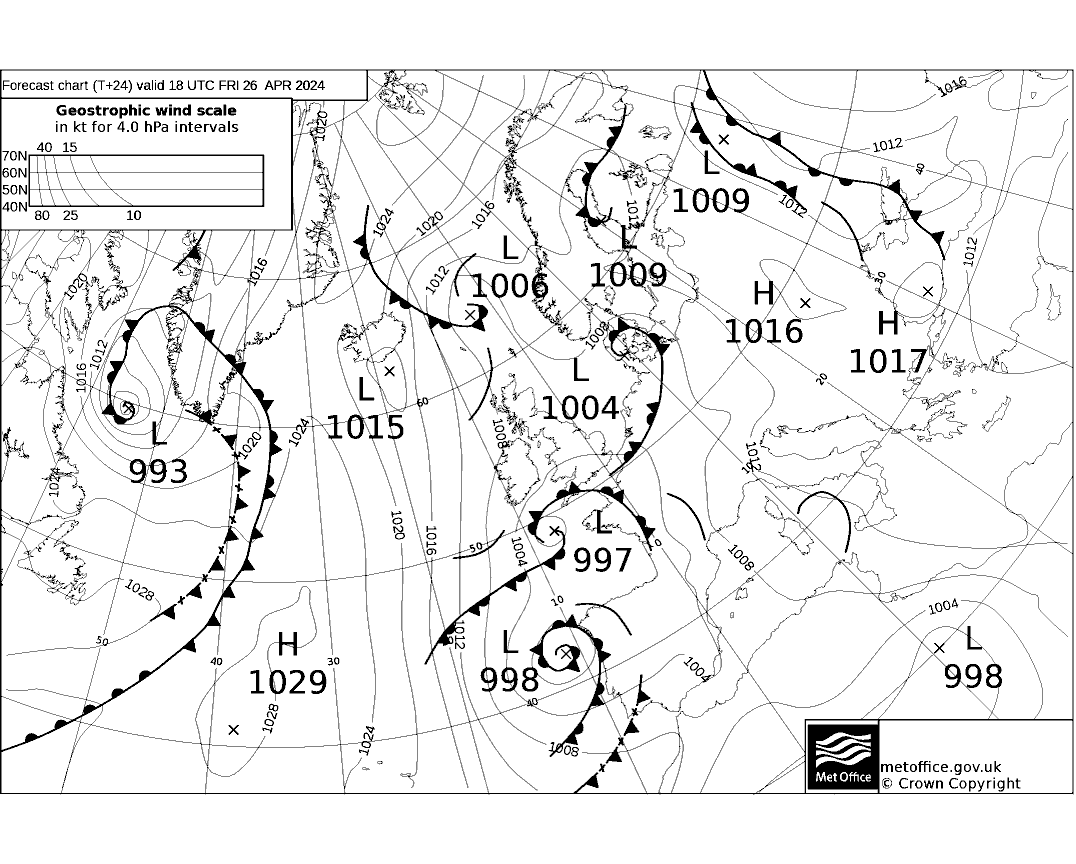
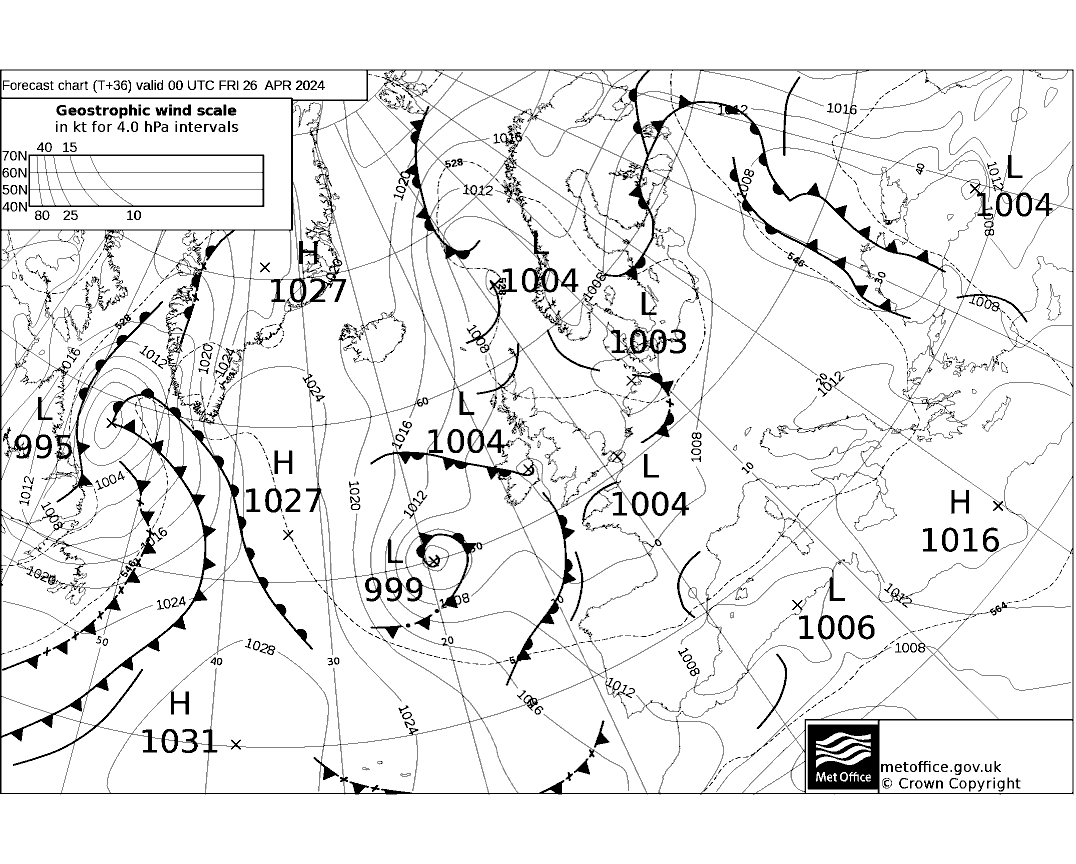
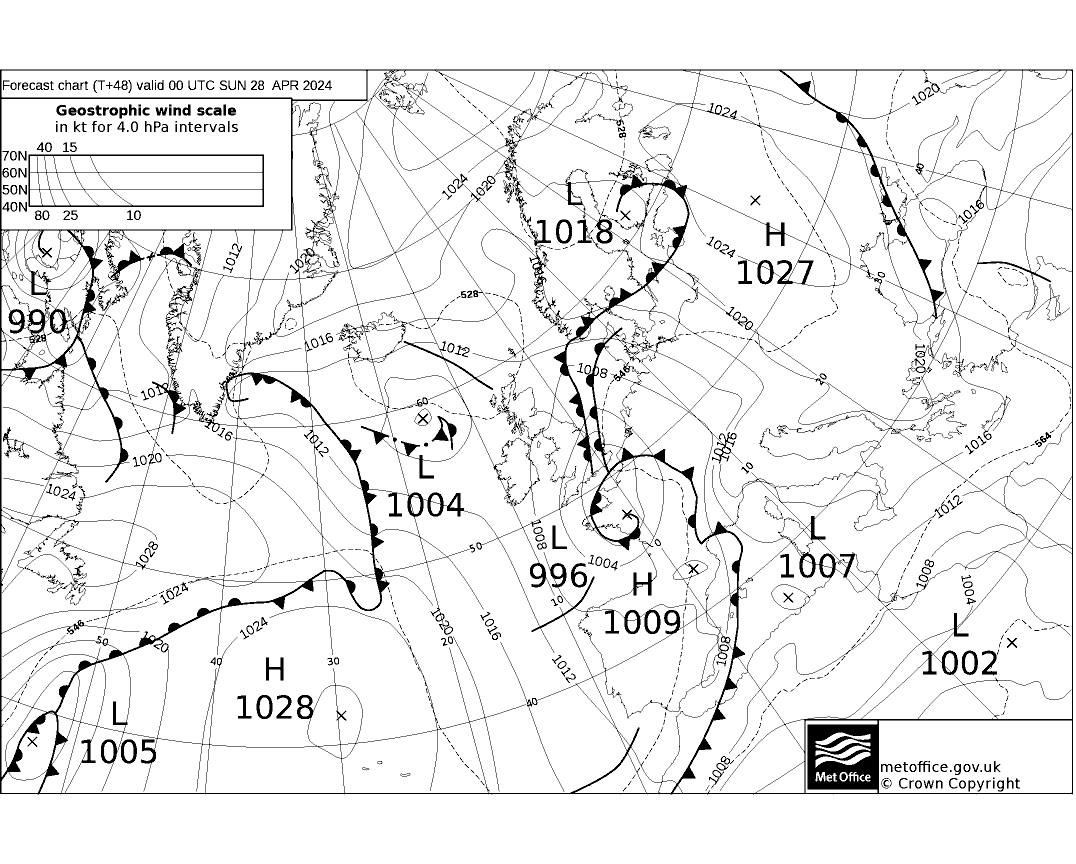
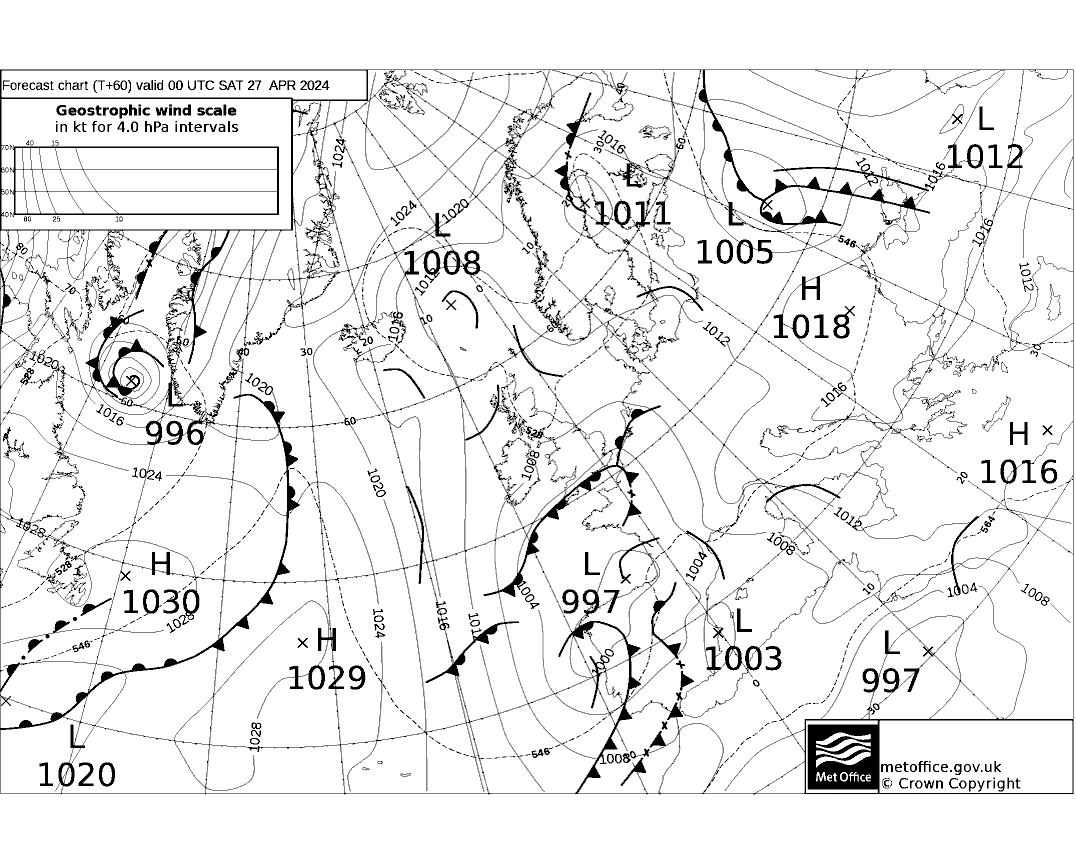
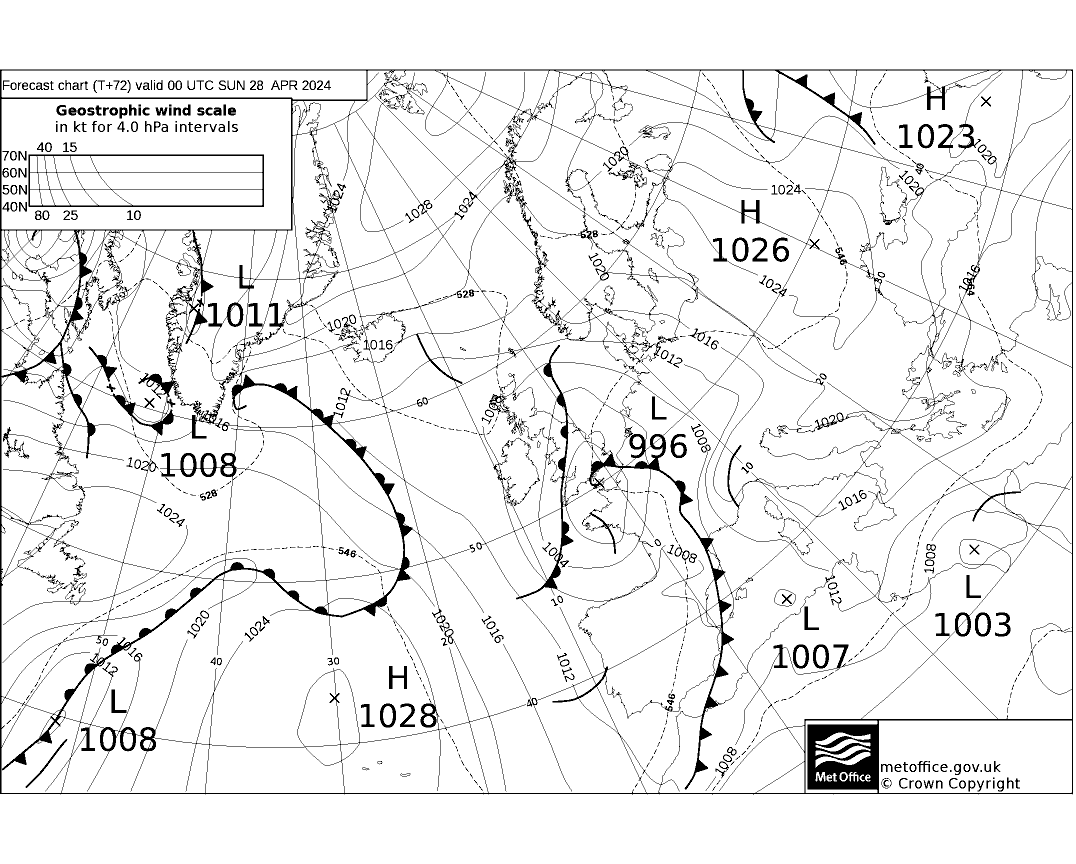
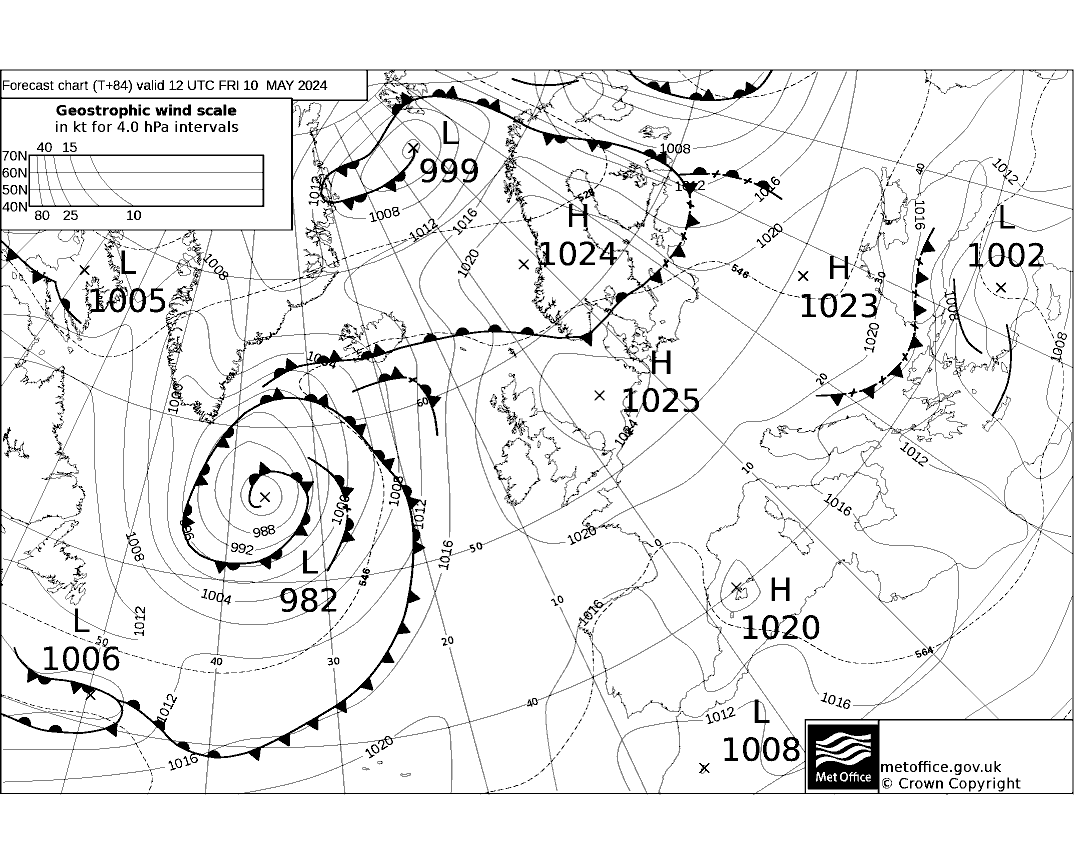
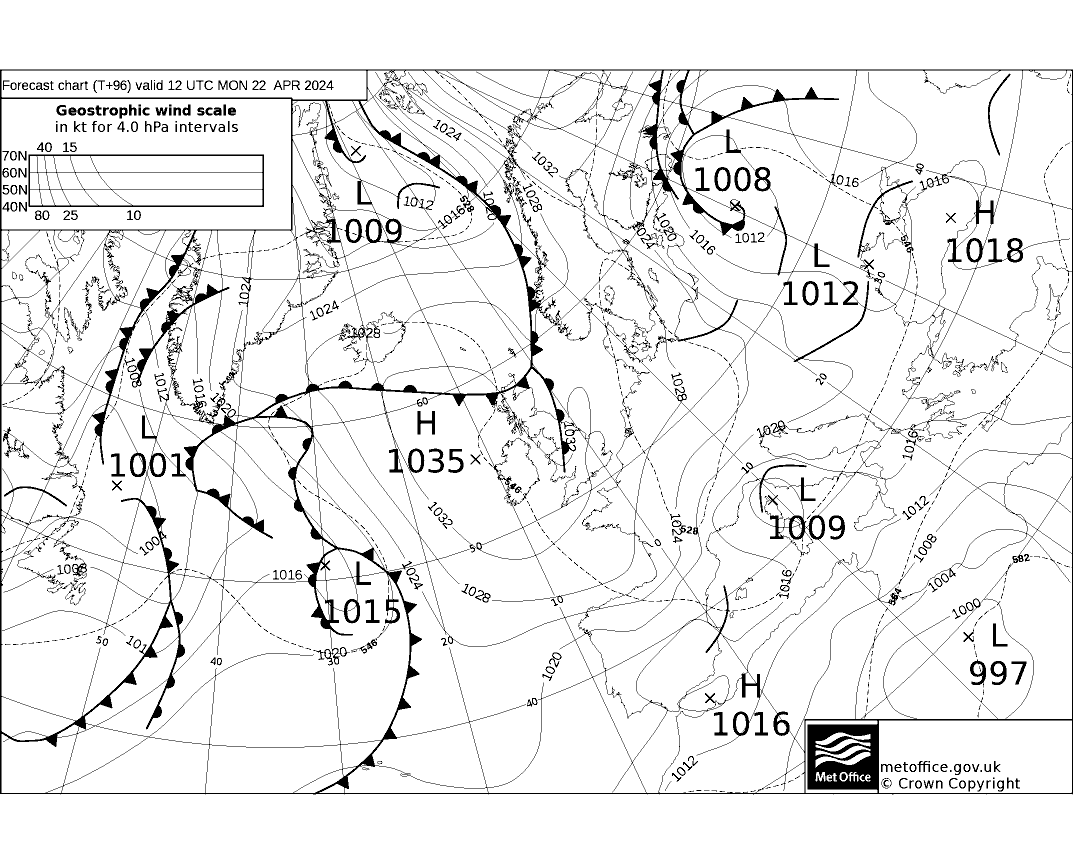
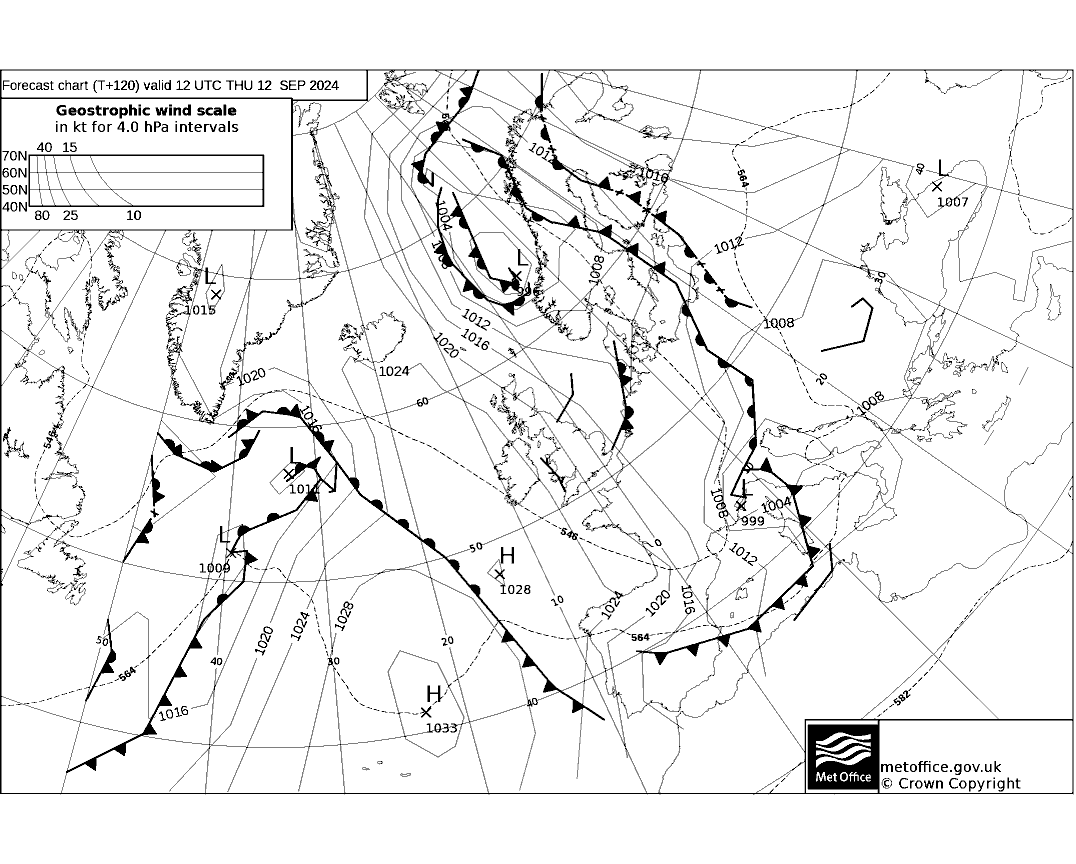
Office North Atlantic and European 5 Day Surface Synoptic Charts
:-
Alternative source : T+0 / T+24 / T+36 / T+48 / T+60 / T+72 / T+84 / T+96 / T+120
Meteocentre
MetO GM, GFS, ECMWF and GEM model
comparisons /
Storm Tracking
Data / US
National Weather Service (NWS) NCEP Data :- Weatheronline
GFS maps
/ NW Europe GFS Menu (Westwind) Wetterzentrale
GFS menu /
GFS data via Wetter3.de
- Wetter3 charts - Wetter3 Animations NCEP GFS 10 day panel forecast for Europe NCEP GFS European charts up to T+144
in greater detail NCEP GFS 15 Day location plots via IPS MeteoStar / IPS MeteoStar GFS charts DIY Model charts from various sources via University of Wyoming NCEP Ensemble forecast products / GFS Ensemble Plots Air Resources Laboratory (READY) NCEP/NOAA Model products FSU
Experimental forecast Tropical
Cyclone Genesis Potential Fields
|
| Reference
:- Martin Rowley's guide to Forecast Charts and Model Output from the uk.sci.weather FAQ Global Model Verification (1and 5-day global model performance) / NCEP
|
Updated
November 2, 2017